Diversity Survey 2021
In September 2021, the VMB carried out a D-BSSE wide survey to assess different dimensions of diversity in our department. The response rate was remarkable, with 154 participants in only two days. This survey intends to identify points-of-action to make D-BSSE as diverse, inclusive, and equal as possible.
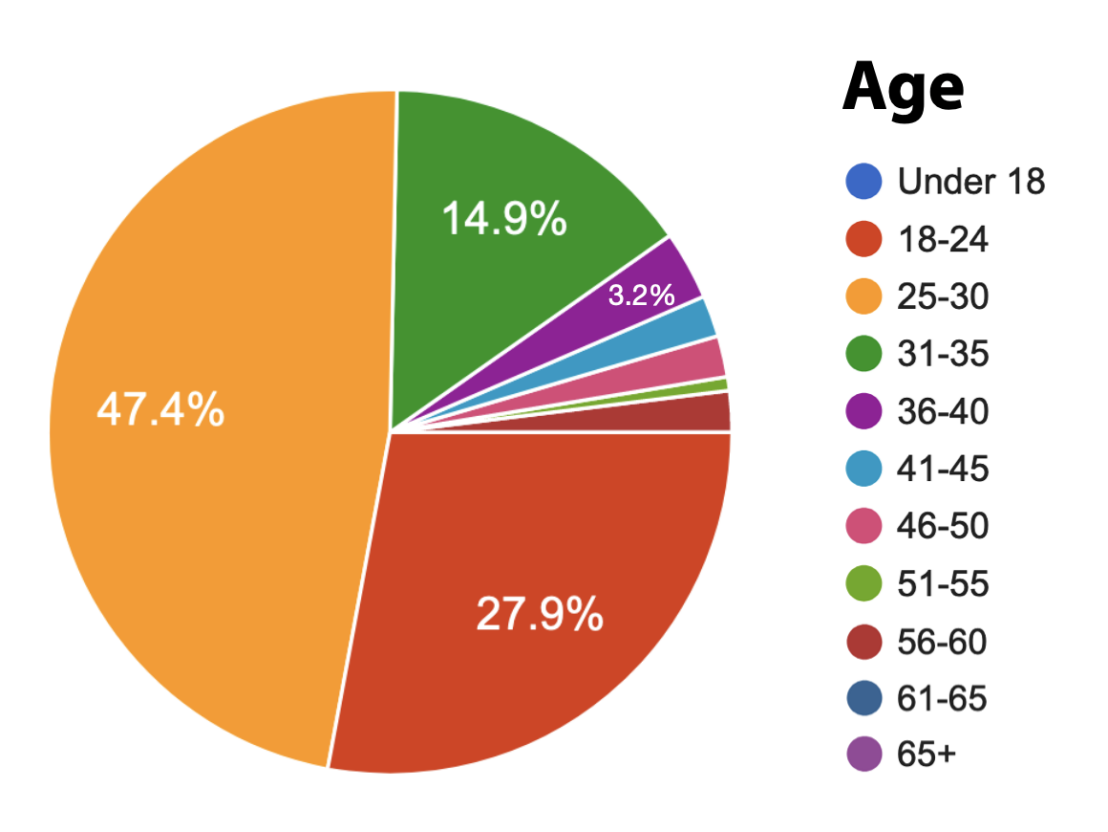
Age
The most abundant age range of participants was 25-30 years (47.4%), followed by 18-24 years (27.9%), and 31-35 years (14.9%). These numbers probably reflect the groups of doctoral students, MSc students, and postdocs. 3.2% of the participants were 36-40 years old, 3.8% were 41-45 and 46-50 years old, and only 2.5% were older than 50 years old.
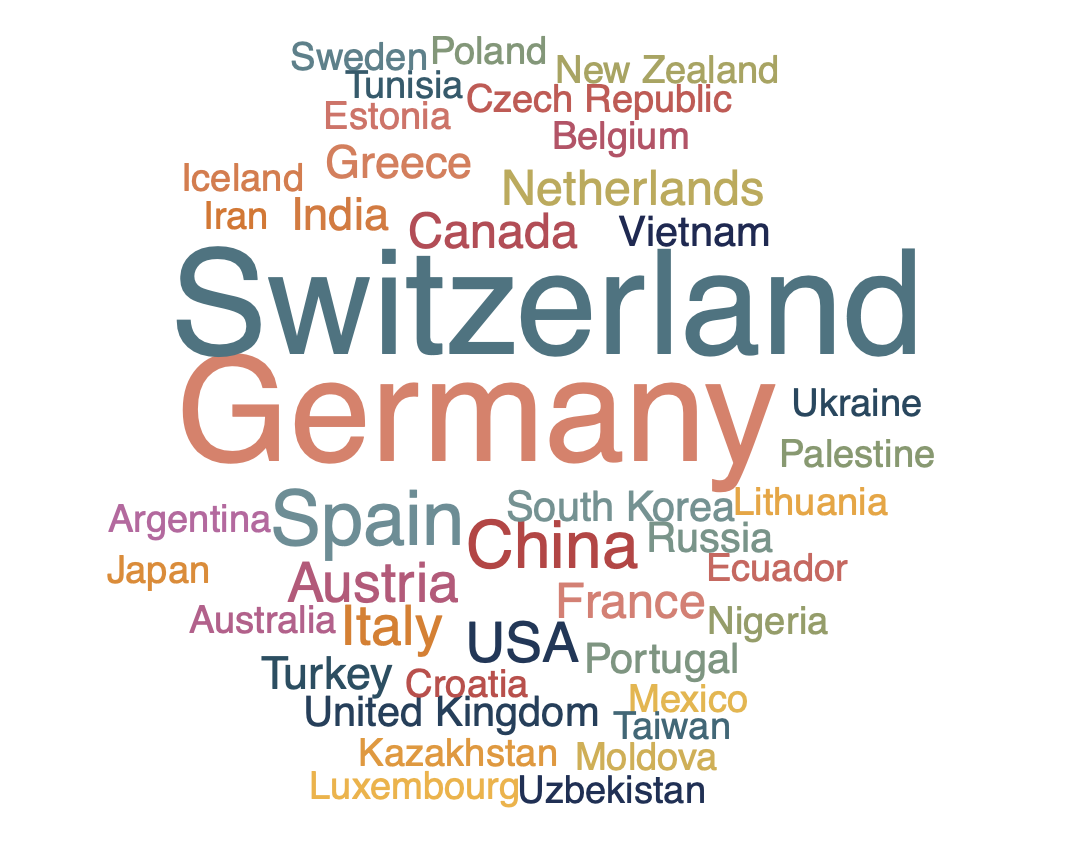
Nationality
42 different nationalities were registered, with Swiss and German being the most common, followed by Spanish and Chinese. The presence of all nations represented at D-BSSE can be observed in the corresponding word cloud.
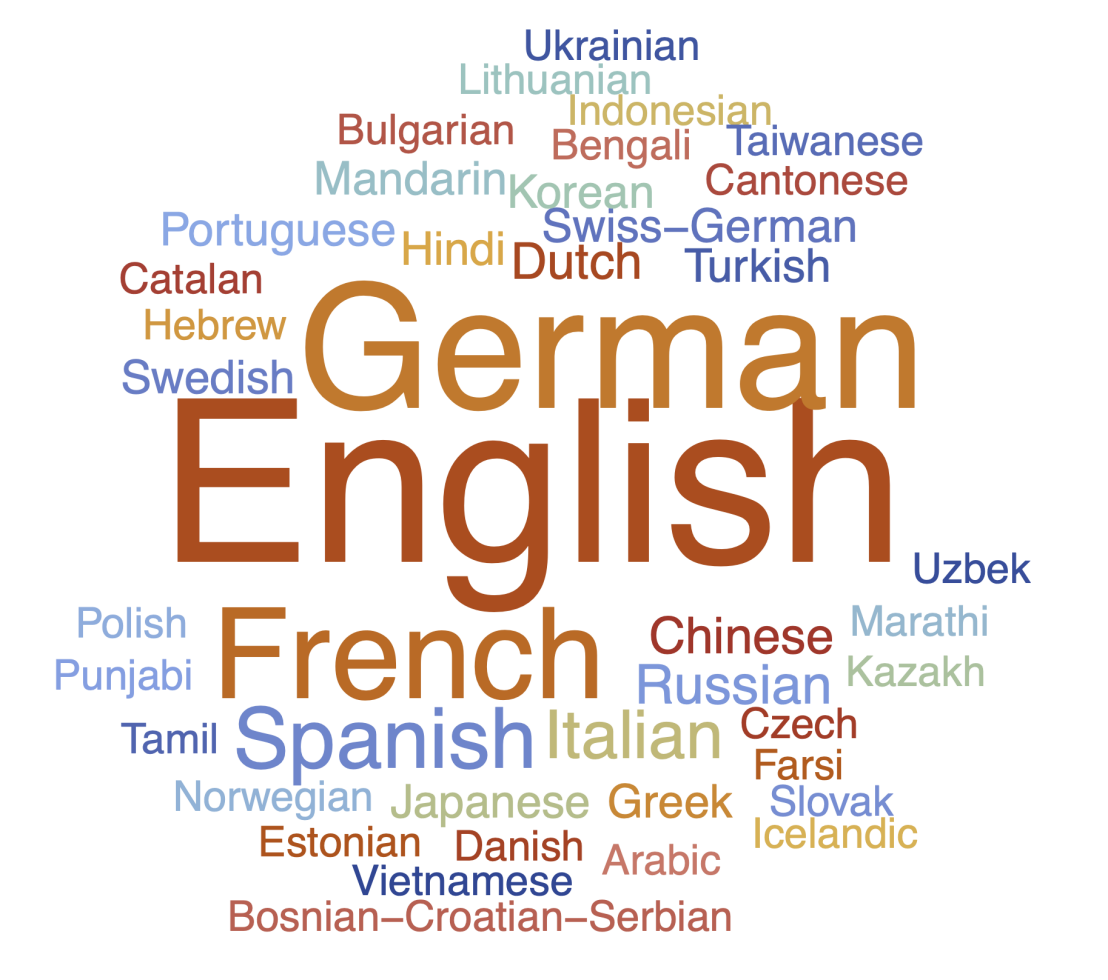
Language
As expected, English was the most spoken language at D-BSSE, followed by German, French, Spanish, and Italian. That said, a much vaster variety of languages are spoken across our Department. Also of note, most participants of the survey replied they can speak multiple languages (albeit at various proficency levels).
Ethnic identity
This section revealed a wide majority of self-described White or Caucasian individuals (65.4%), but also a group of 9.3% that does not identify with any race/ethnicity. Hispanic or Latino and South-east Asian or Pacific Islander were the next most abundant ethnic groups, with 6% representation each, followed closely by Southern Asian (4.7%), East Asian (3.3%), and Middle-Eastern or Arab (2%).
Some participants (7.4%) deviated from the predefined categories and defined themselves as European, Asian, Chinese, Japanese, or mixed. This reflects the unclear nature of racial definitions and opens up the debate about racial and ethnic diversity.
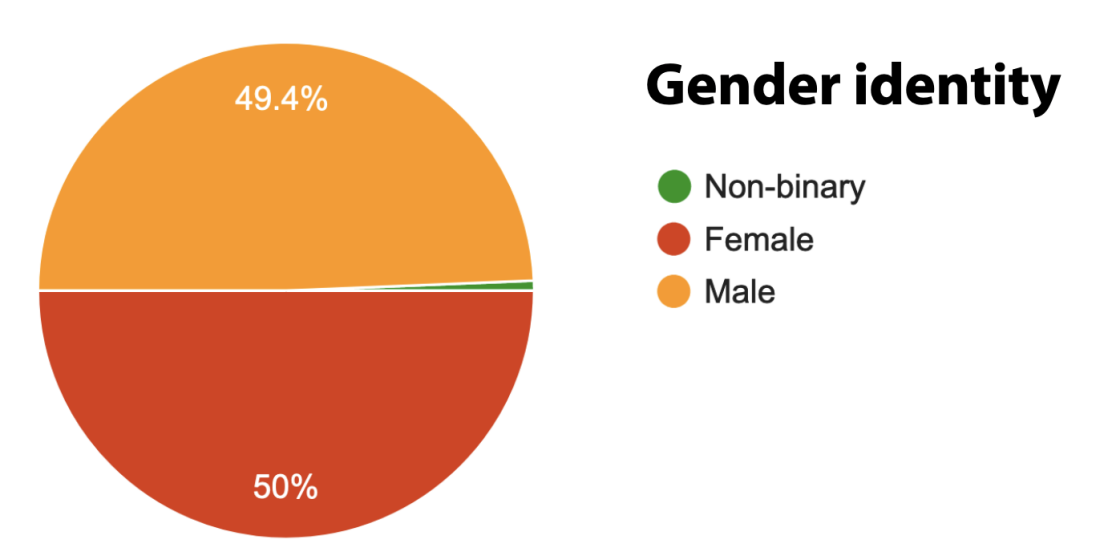
Gender identity
The ratio between male and female participants was close to 50/50, with a 0.6% representation of non-binary categories.
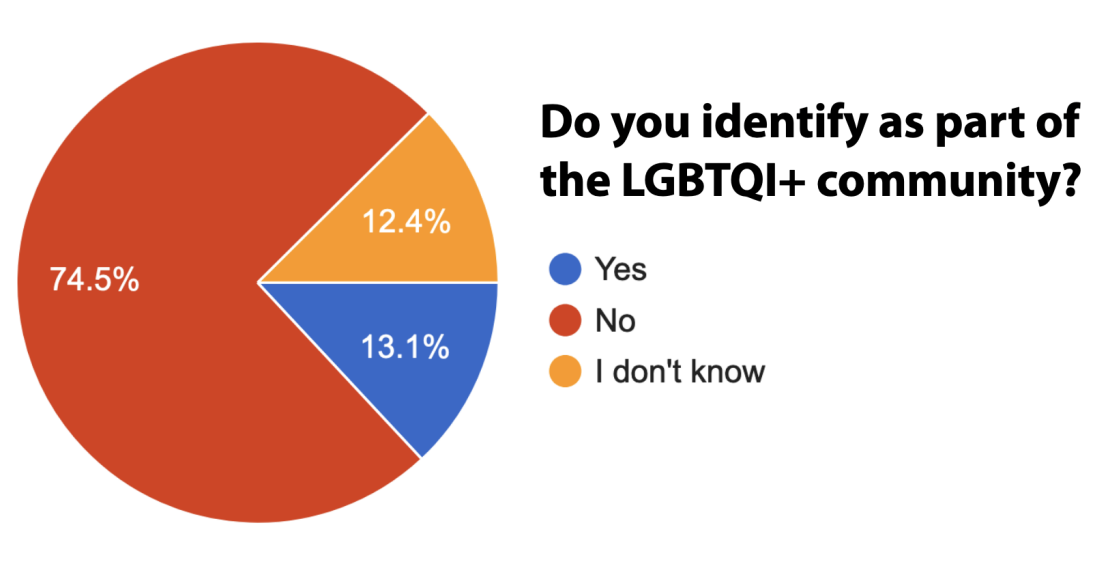
Sexual orientation
13.1% of the participants identified with the LGBTQI+ community and 12.4% responded with “I don’t know”.
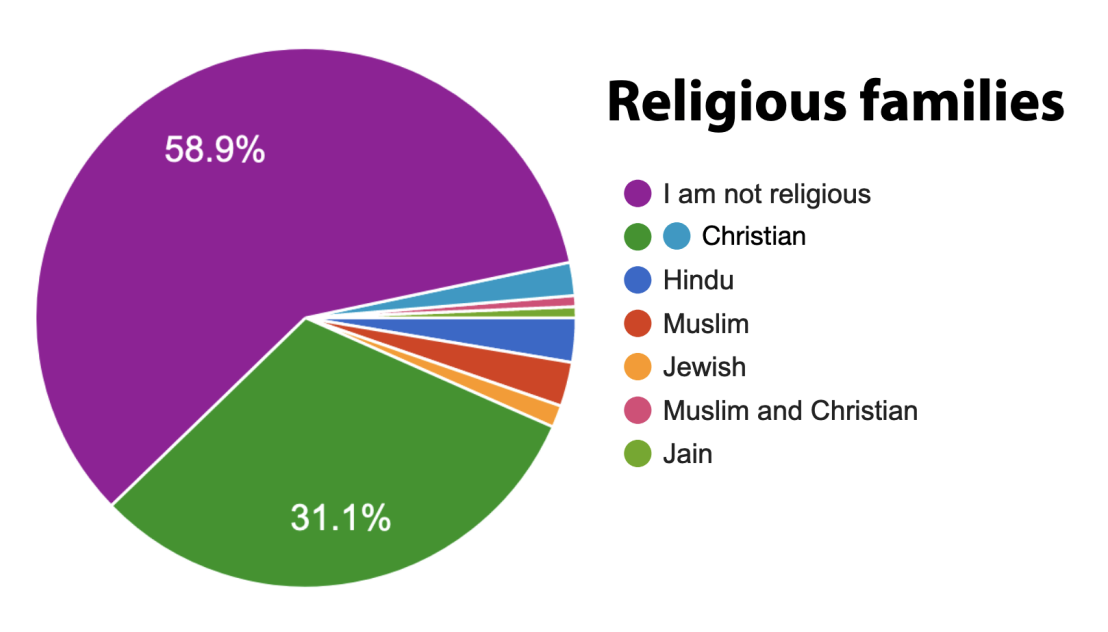
Religion
A wide majority of participants (79.9%) responded that they are not religious, while 11% answered they are, and 9.1% did not know. However, when asked which religious family participants identify closest with, only 60% identified themselves as non-religious. The most present religious family was Christian (Catholic, Protestant, or any other denomination, 33.1%), followed by Muslim and Hindu (both 2.6%) and Jewish (1.3%). In addition, the Jain family and Muslim and Christian faith together were represented by 0.7% each.
Physical and Cognitive impairments
2.6% of the participants acknowledged some physical or cognitive impairment, while 92.9% did not, and 4.5% were not sure. When asked if D-BSSE responded to their special needs, participants responded equally positively and negatively (both with 48.1% of total cases), while 3.7% were undecided.
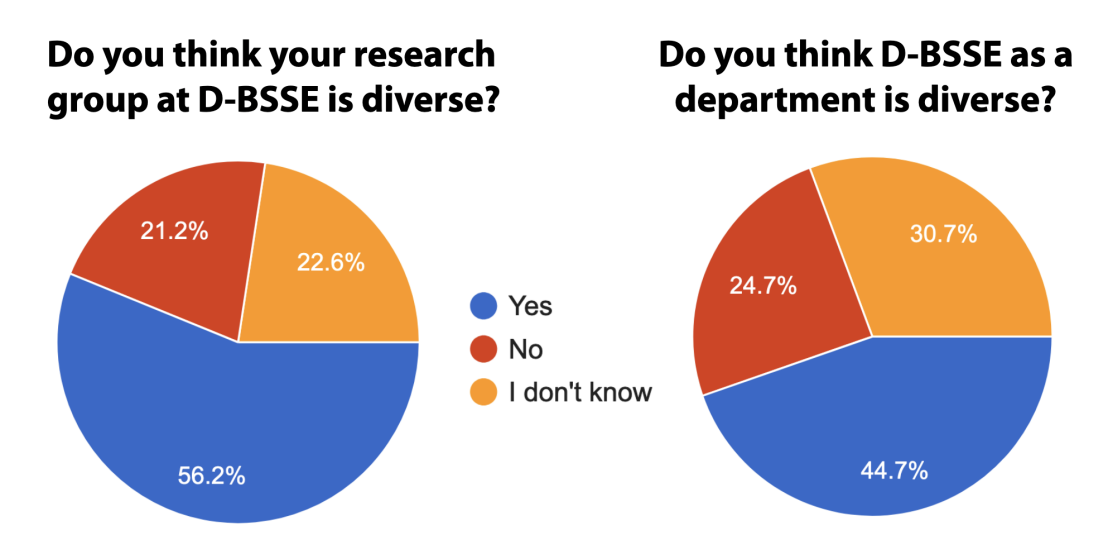
Diversity in the workplace
When asked about their research group, 56.2% of participants thought that it is diverse, while 21.2% thought it is not, and 22.6% did not know. The rate of participants viewing the department as diverse slightly dropped to 44.7%, with 24.7% of participants thinking D-BSSE is not diverse, and much more undecided (30.7%).
Feedback from the D-BSSE community
We concluded the VMB Diversity survey with possible feedback from the participants about which kind of diversity-related initiative they would like to have at our department. Although it was mentioned that diversity-related events could potentially work against diversity principles, the vast majority of participants were enthusiastic about new initiatives to learn about and acknowledge diversity. Our examples of unconscious bias training and cultural celebrations were the most welcome, but the community also proposed a variety of other events, which are summarized below:
- Ideological diversity training,
- Cultural sensitivity training,
- Education on how to support minorities when discrimination happens,
- Education on changing group dynamics when one gender/nationality is more prominent,
- Education on how to prevent biased hiring or to recruit women/minorities,
- Celebration of awareness months/days (Pride, Science Day, Women’s Day, PhD/Postdoc appreciation days…),
- Creation of animal/plant-friendly areas,
- Setting up of language-specific meet-ups,
- Celebration of international nights (with different countries’ cuisines, drinks…),
- Religious discussions,
- Cooking classes,
- More group exchanges to make diversity training happen naturally,
- Pub Crawls.