Statistical Modeling
We develop novel statistical models for the analysis and integration of various types of data, including clinical data and high-throughput molecular profiling data from single cells. We often employ the framework of probabilistic graphical models. They form a class of statistical models that represent conditional independencies among random variables by a graph and include Bayesian networks and Markov random fields. For example, we have used graphical models for modeling dependencies among mutations and for reconstructing intracellular signaling pathways.
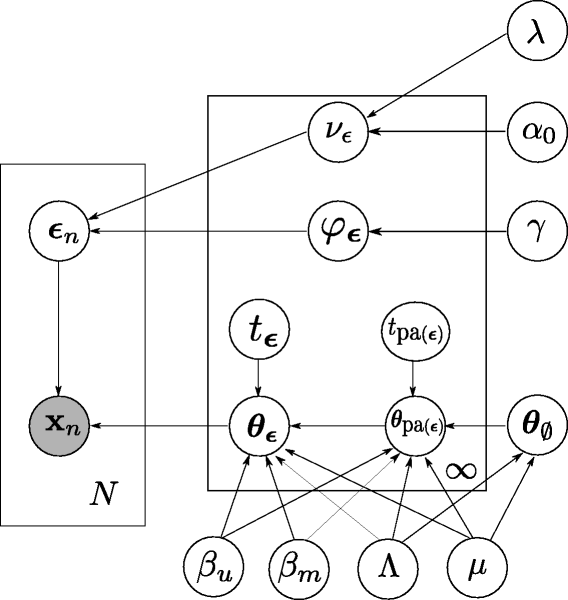
Molecular profiling data are high-dimensional and noisy, which complicates their analysis. Regularization is a common strategy to address this challenge. It involves imposing specific constraints on the model parameters. Using these techniques, we have solved high-dimensional regression problems for the analysis of genome-wide RNA interference data and for predicting cancer type from tumor-derived genomic data.
We are also interested in the statistical and mathematical properties of graphical models, because they can inform about the feasibility and efficiency of the model, such as model complexity, model identifiability, and model comparison.
Selected references:
- external page Single-cell sequencing data reveal widespread recurrence and loss of mutational hits in the life histories of tumors
Kuipers et al., Genome Res, 2017 - external page Improved pathway reconstruction from RNA interference screens by exploiting off-target effects
Srivatsa et al., Bioinformatics, 2018 - external page Structured hierarchical models for probabilistic inference from perturbation screening data
Dirmeier et al., bioRxiv, 2019 - external page Bayesian non-parametric clustering of single-cell mutation profiles
Borgsmüller et al., bioRxiv, 2020